Quins Statistics

Quins Statistics – Quality and Error Analysis for Electronics Manufacturing

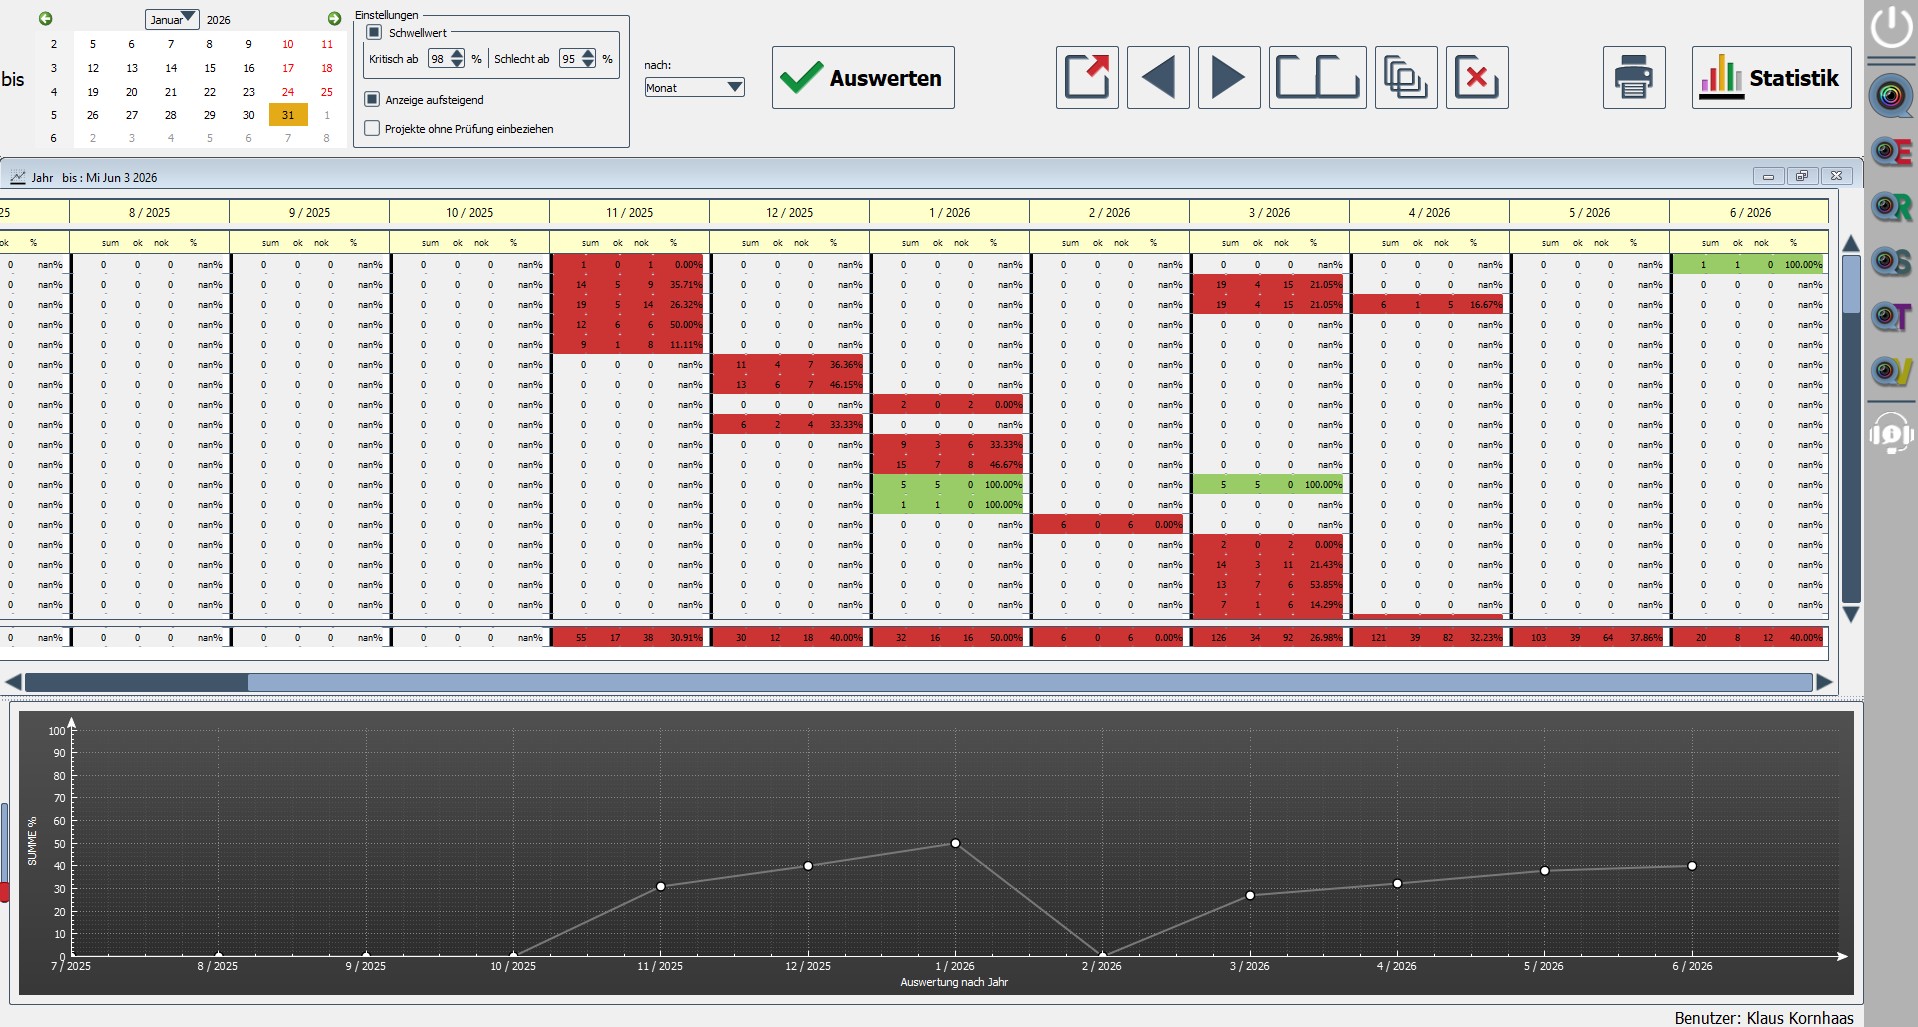
Quins Statistics visualizes test, error and repair data from your QUINS systems. Analyze yield, error types, components, positions, shifts, lines and time periods in clear diagrams. This makes recurring errors and unusual quality developments visible early on.
Reports and statistics

Status: Perfect.

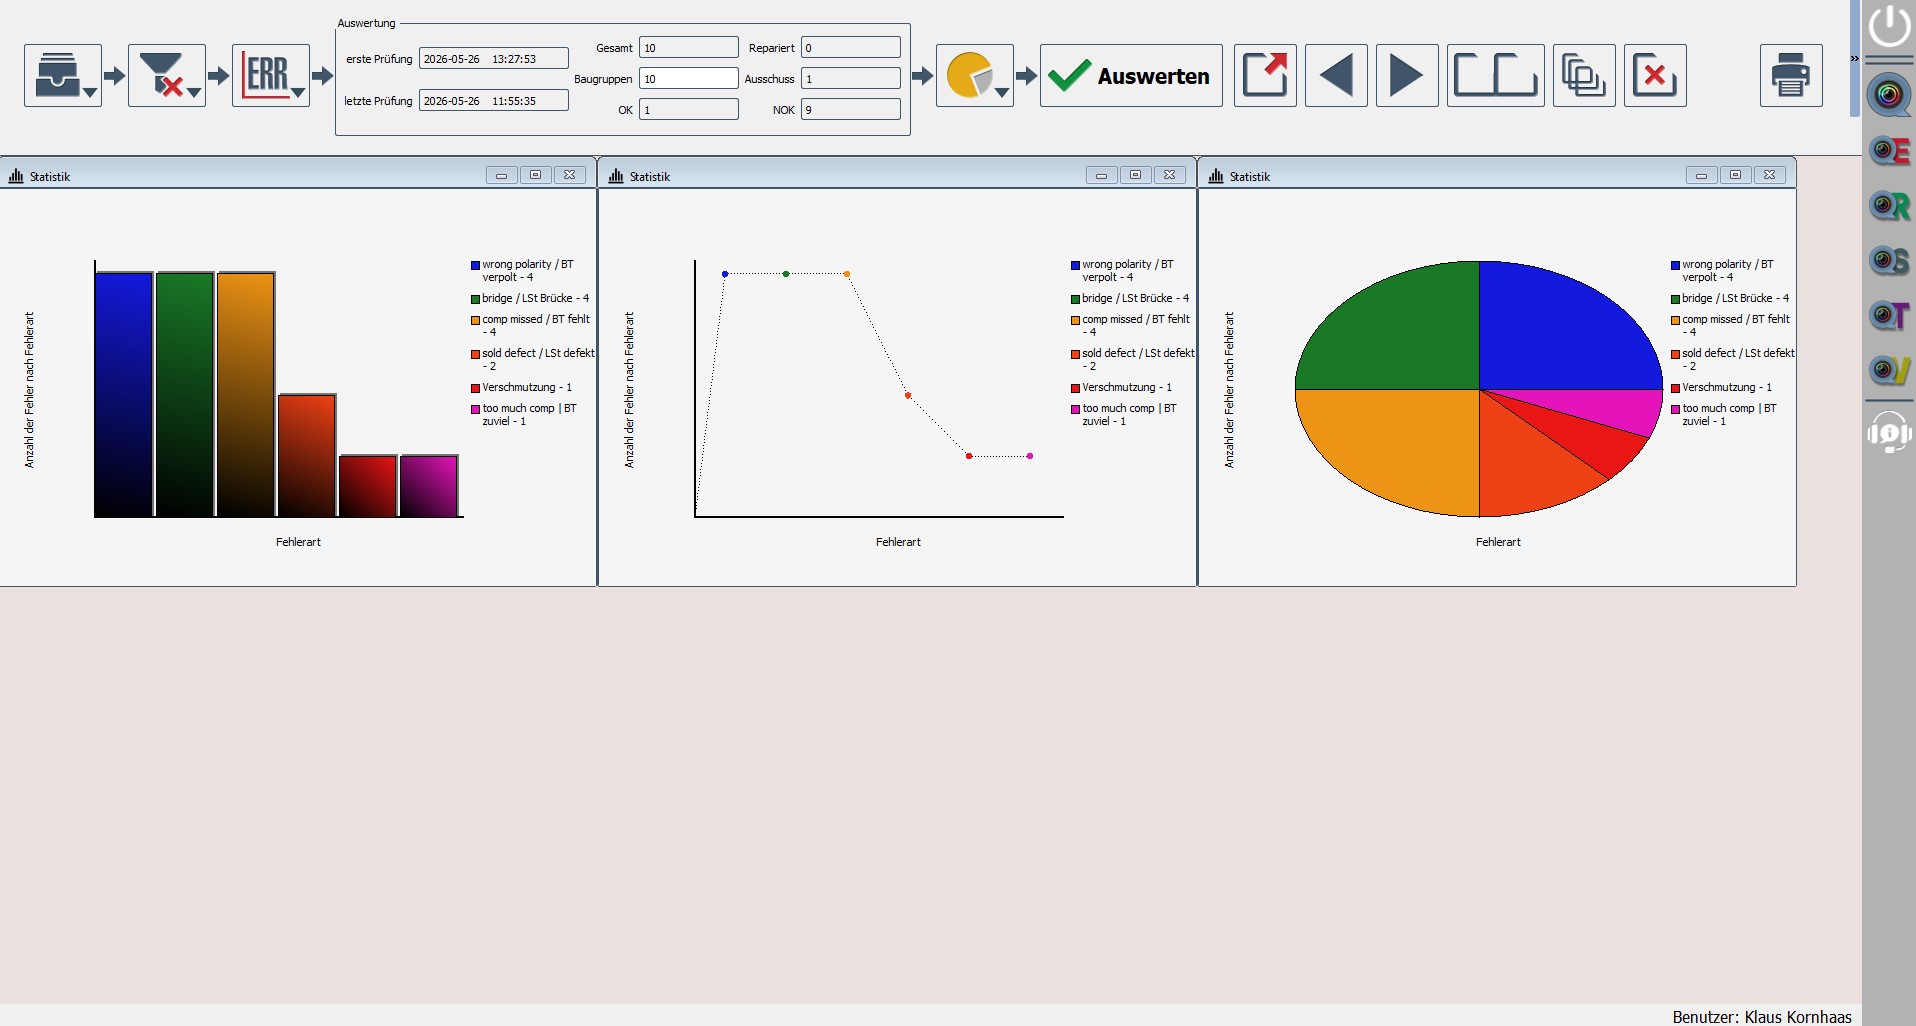
Only if you know your errors can you eliminate them. All information about your quality status. Defect statistics in various display formats on defect type, position, design and component. Yield evaluations provide you with a precise history of your quality level.
Central statistics software for test and quality data

What is Quins Statistics?

Quins Statistics is the analysis module within the QUINS software environment. It takes existing test, error and repair data from connected QUINS systems and displays them in tables, diagrams and quality overviews.
Quins Statistics does not detect errors on the assembly itself. The module makes already recorded quality data comparable and helps identify recurring errors, unusual developments and potential process variations.
Comprehensive data analysis

What data does Quins Statistics evaluate?

Depending on system configuration and data collection, the following data can be evaluated:
Test results: Number of assemblies tested, passed and rejected tests, retests and releases
Error data: Error type, position, component, designator, package type, product, order, time, test station, line and shift
Repair data: Repaired errors, open repairs, pseudo errors, scrap and retest status
Traceability data: Serial number, batch, order, product variant, user, test station, date and time
Systematic process

How Quins Statistics Works

Capture test data

Tests are performed with Quins Easy or other QUINS systems.

Save data

Test results, error types and information are stored.

Select evaluation

Users choose an appropriate statistic, such as yield or error type.

Filter data

Narrow down by time period, order, product or shift.

Compare anomalies

Compare frequencies, changes and distributions graphically.

Investigate cause

Quality managers use results for root cause analysis.

Control measures

Monitor improvements after process adjustments.
Comprehensive analysis functions

Important Evaluations

Yield analysis: Shows quality yield over a selected period and helps determine if the percentage of successful tests remains stable, increases or decreases.
Error type overview: Errors are grouped by defined categories to show which deviations occur most frequently.
Error trend: Time series show whether specific errors occur more or less frequently and help identify trends early.
Component error analysis: Errors can be evaluated by component, part number or package type, if this data is available.
Position analysis: Frequently rejected positions within an assembly can be identified and optimized.
Scrap analysis: Scrap can be evaluated by product, order, error type or time period.
Repair analysis: Repair data shows which errors are reworked most frequently and how repair status develops.
Comparisons at all levels

Shift, Line and Location Comparison

Shift analysis: Test results and error rates of different shifts can be compared if shift information is available.
Line analysis: Production lines can be compared based on their test and error data to identify differences between equipment.
Location comparison: If data from multiple locations is consolidated centrally, quality metrics can be evaluated on a location basis.

Frequently Asked Questions about QUINS Statistics

Software

QUINS Modules at a Glance

QUINS Statistics complements Quins View for traceability, Quins Repair for structured rework and further QUINS modules into an integrated software environment.
Quins Easy SoftwareQuins View SoftwareQuins Repair SoftwareQUINS Statistics SoftwareQuins Tools Software

QUINS Easy

The foundation for simple optical inspection and structured test processes.

QUINS Easy Plus

For extended inspection tasks, first article inspection and optional automation functions.

QUINS AIP

The automatic inspection process supports standardized test workflows and recurring inspection tasks.

QUINS UVI

For automatic UV inspection, especially for conformal coating applications.

QUINS View

For automatic documentation and traceable test results.

QUINS Repair

For repair and rework processes with clear feedback on identified errors.

QUINS Statistics

For evaluations, key metrics and quality analyses from test data.

QUINS Tools

For data control, setup support and preparatory test processes.

The best when it comes to simple inspection.

Easy operation
Brilliant images
Made in Germany
Quins Pro System